Crop Monitor for AMIS
Report Information
No. 139: Published June 4th 2026
Conditions as of May 28th
To access all reports, please visit the Archive.
Please visit the Referencing Guidelines page for information on how to cite the Crop Monitor reports and products.
Overview
At the end of May, overall conditions are positive for wheat, maize, rice, and soybeans. For wheat, spring wheat sowing is progressing in the Northern Hemisphere after a slow start in Canada and the Russian Federation. In the Southern Hemisphere, sowing is beginning. For maize, harvesting is advancing in the Southern Hemisphere, and sowing wraps up in the Northern Hemisphere. Rice conditions are favourable as South and Southeast Asia transition between seasons. For soybeans, harvesting advances in the Southern Hemisphere as sowing expands in the Northern Hemisphere.
Global crop condition map synthesizing information for all four AMIS crops as of May 28th. Crop conditions over the main growing areas for wheat, maize, rice, and soybean are based on a combination of national and regional crop analyst inputs and earth observation data. Crops under non-favourable conditions are displayed on the map using their crop symbols.
Crop Conditions at a Glance
Wheat – In the Northern Hemisphere, spring wheat sowing is progressing after a slow start in Canada and the Russian Federation. In the Southern Hemisphere, sowing is beginning.
Maize – Harvesting is progressing in the Southern Hemisphere as sowing wraps up in the Northern Hemisphere.
Rice – Global conditions are mostly favourable as South and Southeast Asia transition between seasons.
Soybeans – In the Southern Hemisphere, harvesting advances as sowing expands in the Northern Hemisphere.
Forecasts at a Glance
Climate Influences – Neutral ENSO conditions are present. El Niño conditions are forecast to quickly develop and persist through early 2027. There are 82% chances of El Niño conditions during May to July 2026, and 96% chances during December 2026 to February 2027.
Australia - The June – August 2026 outlook indicates likely below-average precipitation and above-average maximum and minimum temperatures for most of the country.
Southeast Asia - Seasonal forecasts predict moderate to high chances of below-normal rainfall during July-September across southern areas and during October to December in Vietnam, eastern Cambodia, the Philippines, and the southern parts of the Maritime region.
United States – The June precipitation forecast indicates likely above-average precipitation over parts of the central and southern Great Plains, and the Southeast, while below-average precipitation is likely over the Pacific Northwest and the northeastern Corn Belt.
Wheat Conditions
Wheat crop conditions over the main growing areas are based on national and regional crop analyst inputs and earth observation data. Crop condition information is based on information as of May 28th. Where crops are in conditions other than favourable, the climatic drivers responsible for those conditions are displayed. Crop Season Specific Maps can be found in Appendix 2.
In the EU, winter wheat is under generally favourable conditions, despite some dryness and a late cold spell in central Europe. In Türkiye, winter wheat conditions are favourable with above-average yields expected. In Ukraine, winter wheat remains under favourable conditions away from the war front. In the Russian Federation, winter wheat is under favourable conditions. Spring wheat sowing is progressing and reducing the large delay due to earlier cold and wet weather. In Kazakhstan, winter wheat is under favourable conditions as spring wheat sowing advances. In China, winter wheat harvest is beginning under favourable conditions as spring wheat develops. In the US, conditions for winter wheat in the Great Plains continue to deteriorate as harvesting begins in the south. Spring wheat sowing advances faster than normal. In Canada, spring wheat sowing is ongoing, albeit with delays due to cool temperatures and wet conditions. Winter wheat is under favourable conditions. In Australia, sowing is ongoing, albeit under dry conditions across northern New South Wales and southern Queensland. A sizable decline in total sown area is expected compared to last year.
For detailed description of the pie chart please see box at the bottom of the page.
Maize Conditions
Maize crop conditions over the main growing areas are based on national and regional crop analyst inputs and earth observation data. Crop condition information is based on information as of May 28th. Where crops are in conditions other than favourable, the climatic drivers responsible for those conditions are displayed. Crop Season Specific Maps can be found in Appendix 2.
Maize: In Brazil, the harvest of the spring-planted crop (smaller season) is advancing under mostly exceptional conditions. The summer-planted crop (larger season) is developing, with an increase in total sown area compared to last year. In Argentina, the harvest of early-planted crops (larger season) is finishing, while the late-planted crop (smaller season) is awaiting grain dry-down and the conclusion of the soybean harvest, which remains the priority. In South Africa, harvest is wrapping up with mostly above-average yields. In the US, sowing continues, with an expected reduction in total sown area compared to last year. In Canada, sowing is beginning more slowly than normal due to cold, wet weather. In Mexico, conditions are favorable for the autumn-winter season (smaller season). In China, sowing of spring-maize (larger season) is continuing under favorable conditions. In Indonesia, the harvest of the wet-season crop is progressing as sowing of the dry-season crop continues. In the EU, sowing is finishing, with dryness in central Europe and some delays in southeastern Europe. In Ukraine, sowing is ending, with some dry soils in the western region. In the Russian Federation, sowing is wrapping up.
For detailed description of the pie chart please see box at the bottom of the page.
Rice Conditions
Rice crop conditions over the main growing areas are based on national and regional crop analyst inputs and earth observation data. Crop condition information is based on information as of May 28th. Where crops are in conditions other than favourable, the climatic drivers responsible for those conditions are displayed. Crop Season Specific Maps can be found in Appendix 2.
Rice: In China, conditions are favourable for early double-crop rice (smallest season) and for the continued sowing of single-season rice (largest season). In India, harvesting of the Rabi crop is wrapping up as the Summer crop continues to develop. In Bangladesh, harvesting of the Boro crop (largest season) wraps up with minor losses due to flooding in the low-lying haor regions of the northeast. Sowing continues for the Aus crop (smallest season) and begins for the Aman crop (medium season). In Indonesia, harvesting of wet-season rice continues as sowing advances for dry-season rice. In Viet Nam, the harvest is continuing for winter-spring (dry-season) rice in the south. The sowing of summer-autumn (wet-season) rice is behind normal due to delays in harvesting the winter-spring crop. In Thailand, harvesting is nearly complete for dry-season rice. Sowing of wet-season rice is just beginning, with an expected reduction in total sown area compared to last year due to lower rice prices and rising costs of agricultural inputs. In the Philippines, the dry-season rice harvest is wrapping up as the sowing of wet-season rice begins. In Brazil, the harvest is finishing.
For detailed description of the pie chart please see box at the bottom of the page.
Soybean Conditions
Soybean crop conditions over the main growing areas are based on national and regional crop analyst inputs and earth observation data. Crop condition information is based on information as of May 28th. Where crops are in conditions other than favourable, the climatic drivers responsible for those conditions are displayed. Crop Season Specific Maps can be found in Appendix 2.
Soybeans: In Brazil, the last of the crop is wrapping up harvesting in the South region under favourable conditions. In Argentina, harvesting is progressing for both the early-planting crop (larger season) and the late-planted crop (smaller season), with overall good yields. In South Africa, harvest is wrapping up with above-average yields across most of the country and an increase in total sown area compared to last year and the five-year average. In the US, sowing is progressing rapidly under favourable conditions with an expected increase in total sown area compared to last year. In Canada, sowing is beginning, albeit slightly later than normal due to wet and cold conditions in early May. In China, sowing is ongoing under favourable conditions. In Ukraine, sowing is advancing under generally favourable conditions, albeit with dry soils in the western region.
For detailed description of the pie chart please see box at the bottom of the page.
Pie chart description: Each slice represents a country's share of total AMIS production (5-year average). Main producing countries (representing 95 percent of production) are shown individually, with the remaining 5 percent grouped into the “Other AMIS Countries” category. The proportion within each national slice is coloured according to the crop conditions within a specific growing area; grey indicates that the respective area is out of season. Sections within each slice are weighted by the sub-national production statistics (5-year average) of the respective country. The section within each national slice also accounts for multiple cropping seasons (i.e., spring and winter wheat). When conditions are other than’ favourable’, icons are added that provide information on the key climatic drivers affecting conditions.
Information on crop conditions in non-AMIS countries can be found in the GEOGLAM Crop Monitor for Early Warning.
Climate Influences: El Niño Watch
Neutral ENSO conditions are present. El Niño conditions are forecast to quickly develop and persist through early 2027. There are 82% chances of El Niño conditions during May to July 2026, and 96% chances during December 2026 to February 2027, according to the May 2026 NOAA CPC ENSO outlook. The 2026–2027 El Niño will likely be at least of moderate strength by July to September 2026 (66% chance) and then become a strong or very strong event during October 2026 to January 2027 (~66 % chance). Confidence in current El Niño strength outlooks is limited by model forecast skill. The likelihood of extreme conditions during the coming year will increase as El Niño warms global temperatures.
El Niño events tend to enhance rainfall in Central Asia, southern North America, south-eastern South America, southern Europe, eastern and southern East Africa, and southern and eastern China. Drier-than-average conditions tend to occur in Central America, the Caribbean, northern South America, parts of western and northern East Africa, the Sahel region, Southern Africa, India, northern China, the Maritime Continent, and Australia.
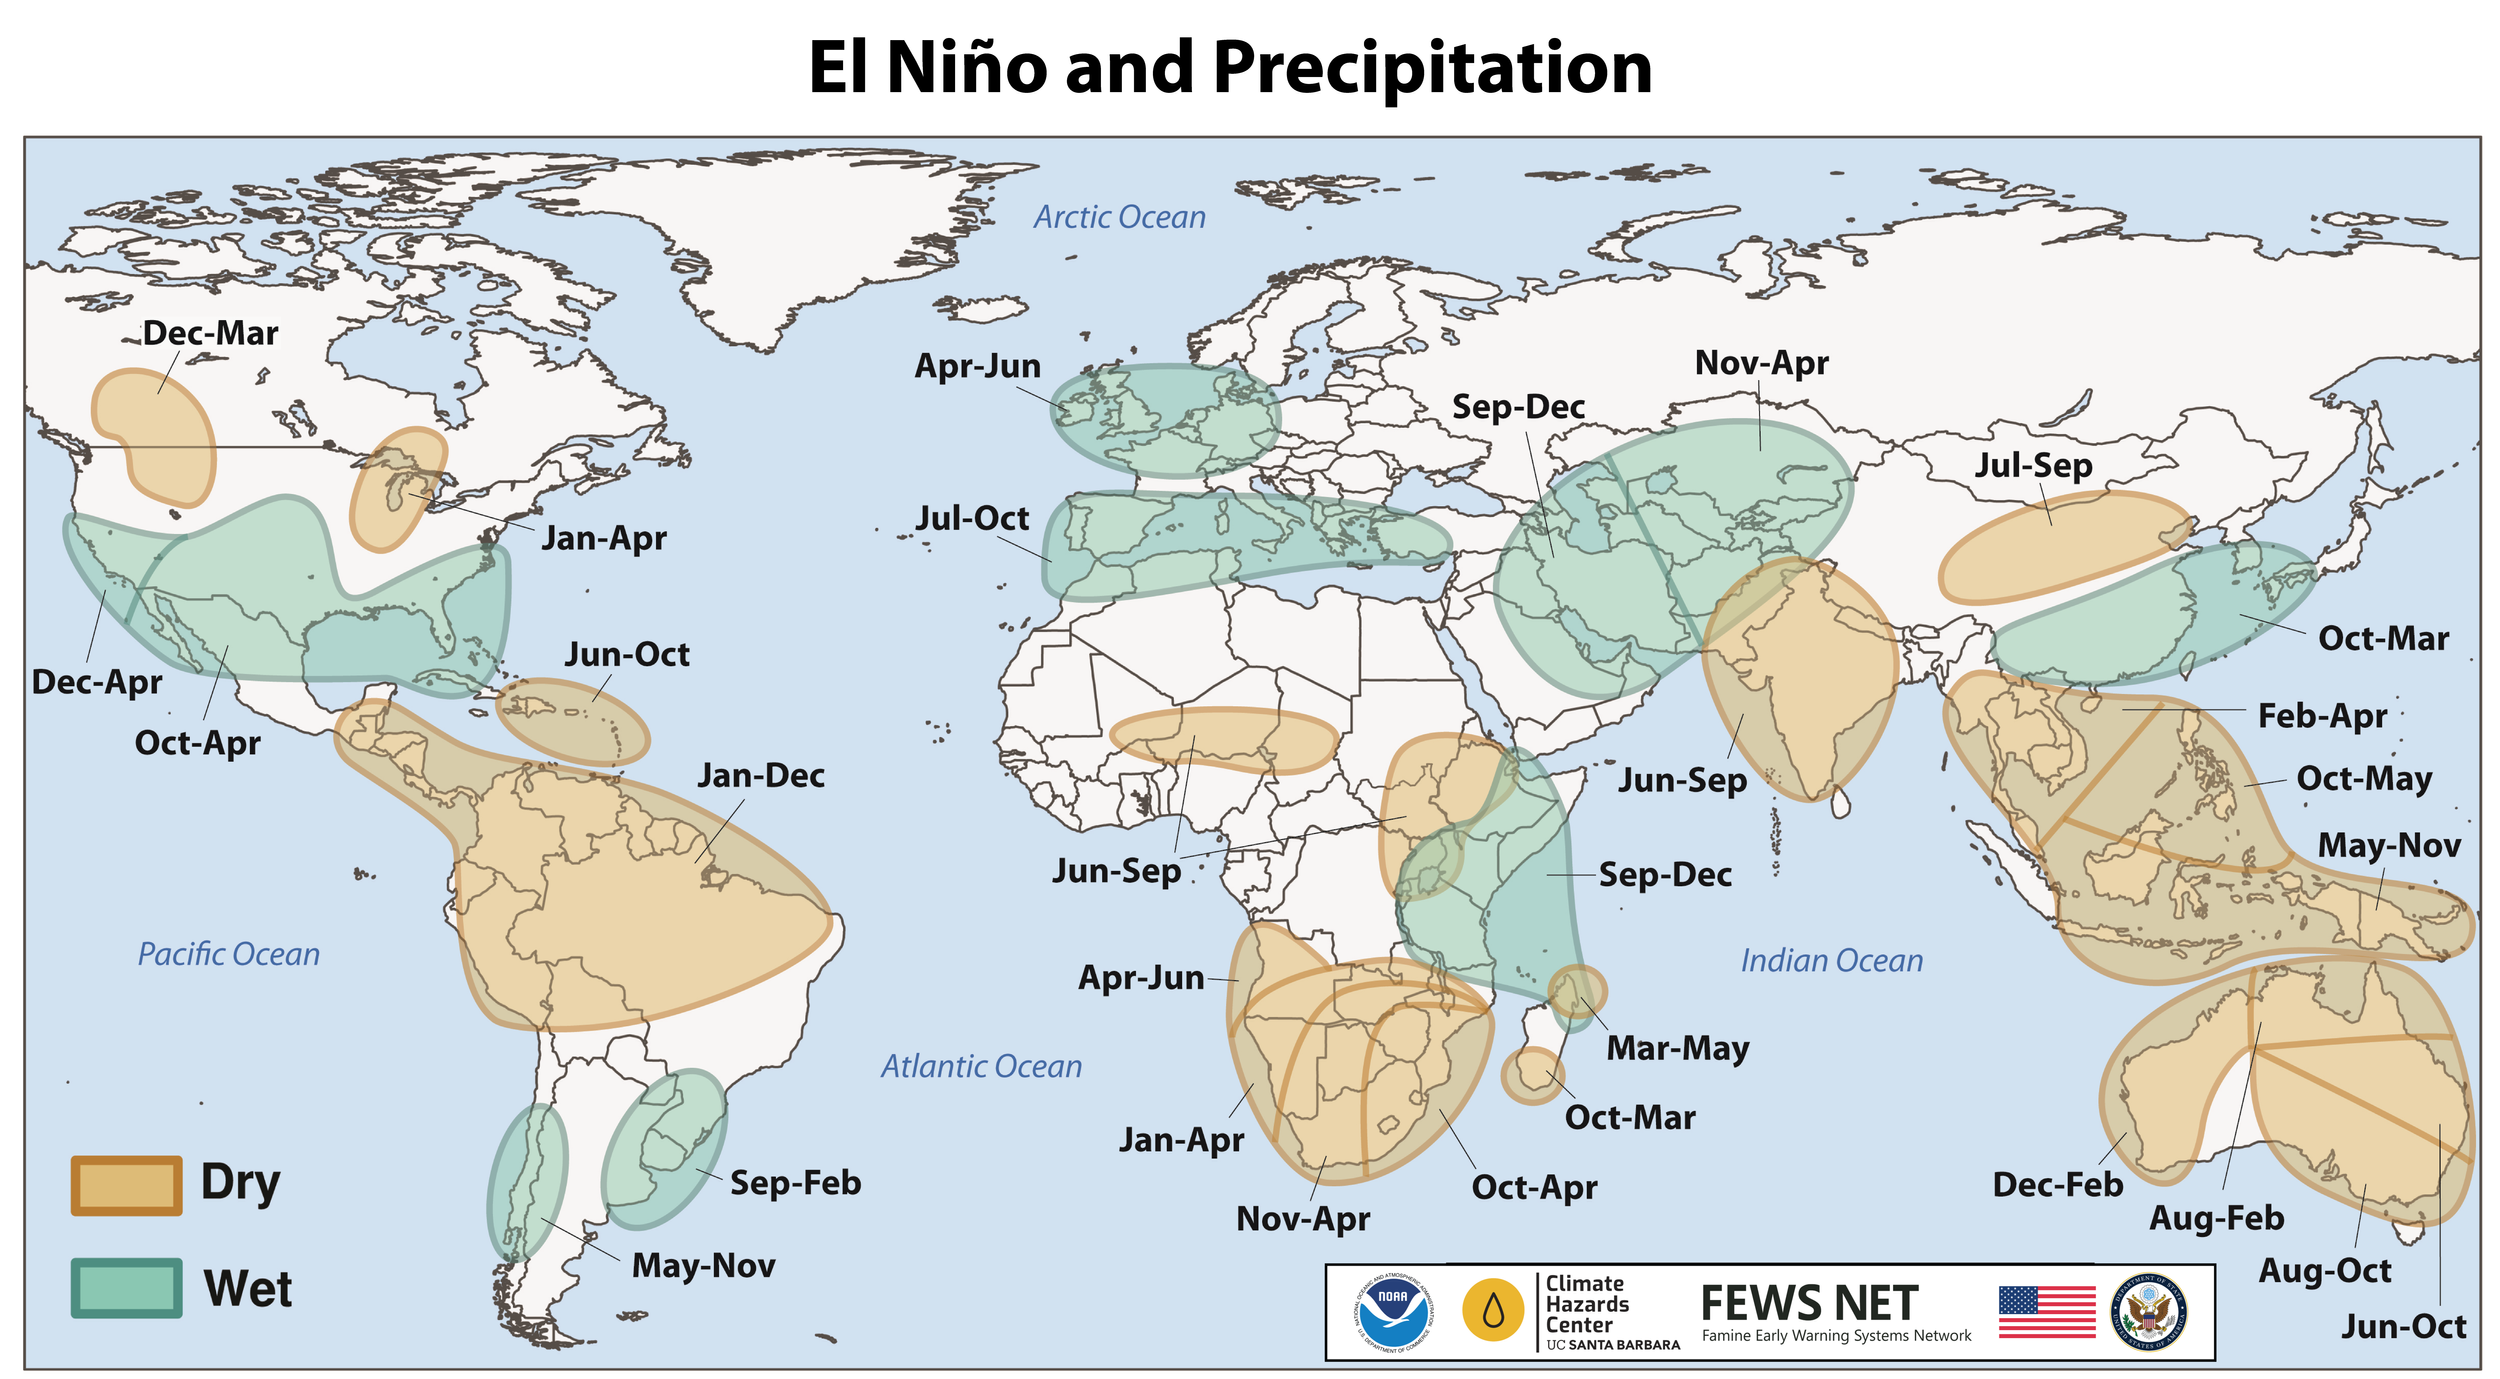
Location and timing of likely above- and below-average precipitation related to El Niño events. Based upon observed precipitation during 22 El Niño events since 1950, wet and dry correspond to a statistically significant increase in the frequency of precipitation in the upper and lower thirds of historical values, respectively. Statistical significance at the 95% level is based on the resampling of precipitation during neutral El Niño-Southern Oscillation conditions. Source: FEWS NET & NOAA & CHC
During late May to late June, above-average temperatures are forecast in Canada, the northern United States, Central America, South America, Europe, central and eastern Asia, India, the Maritime Continent region, central Australia, and across much of Africa.
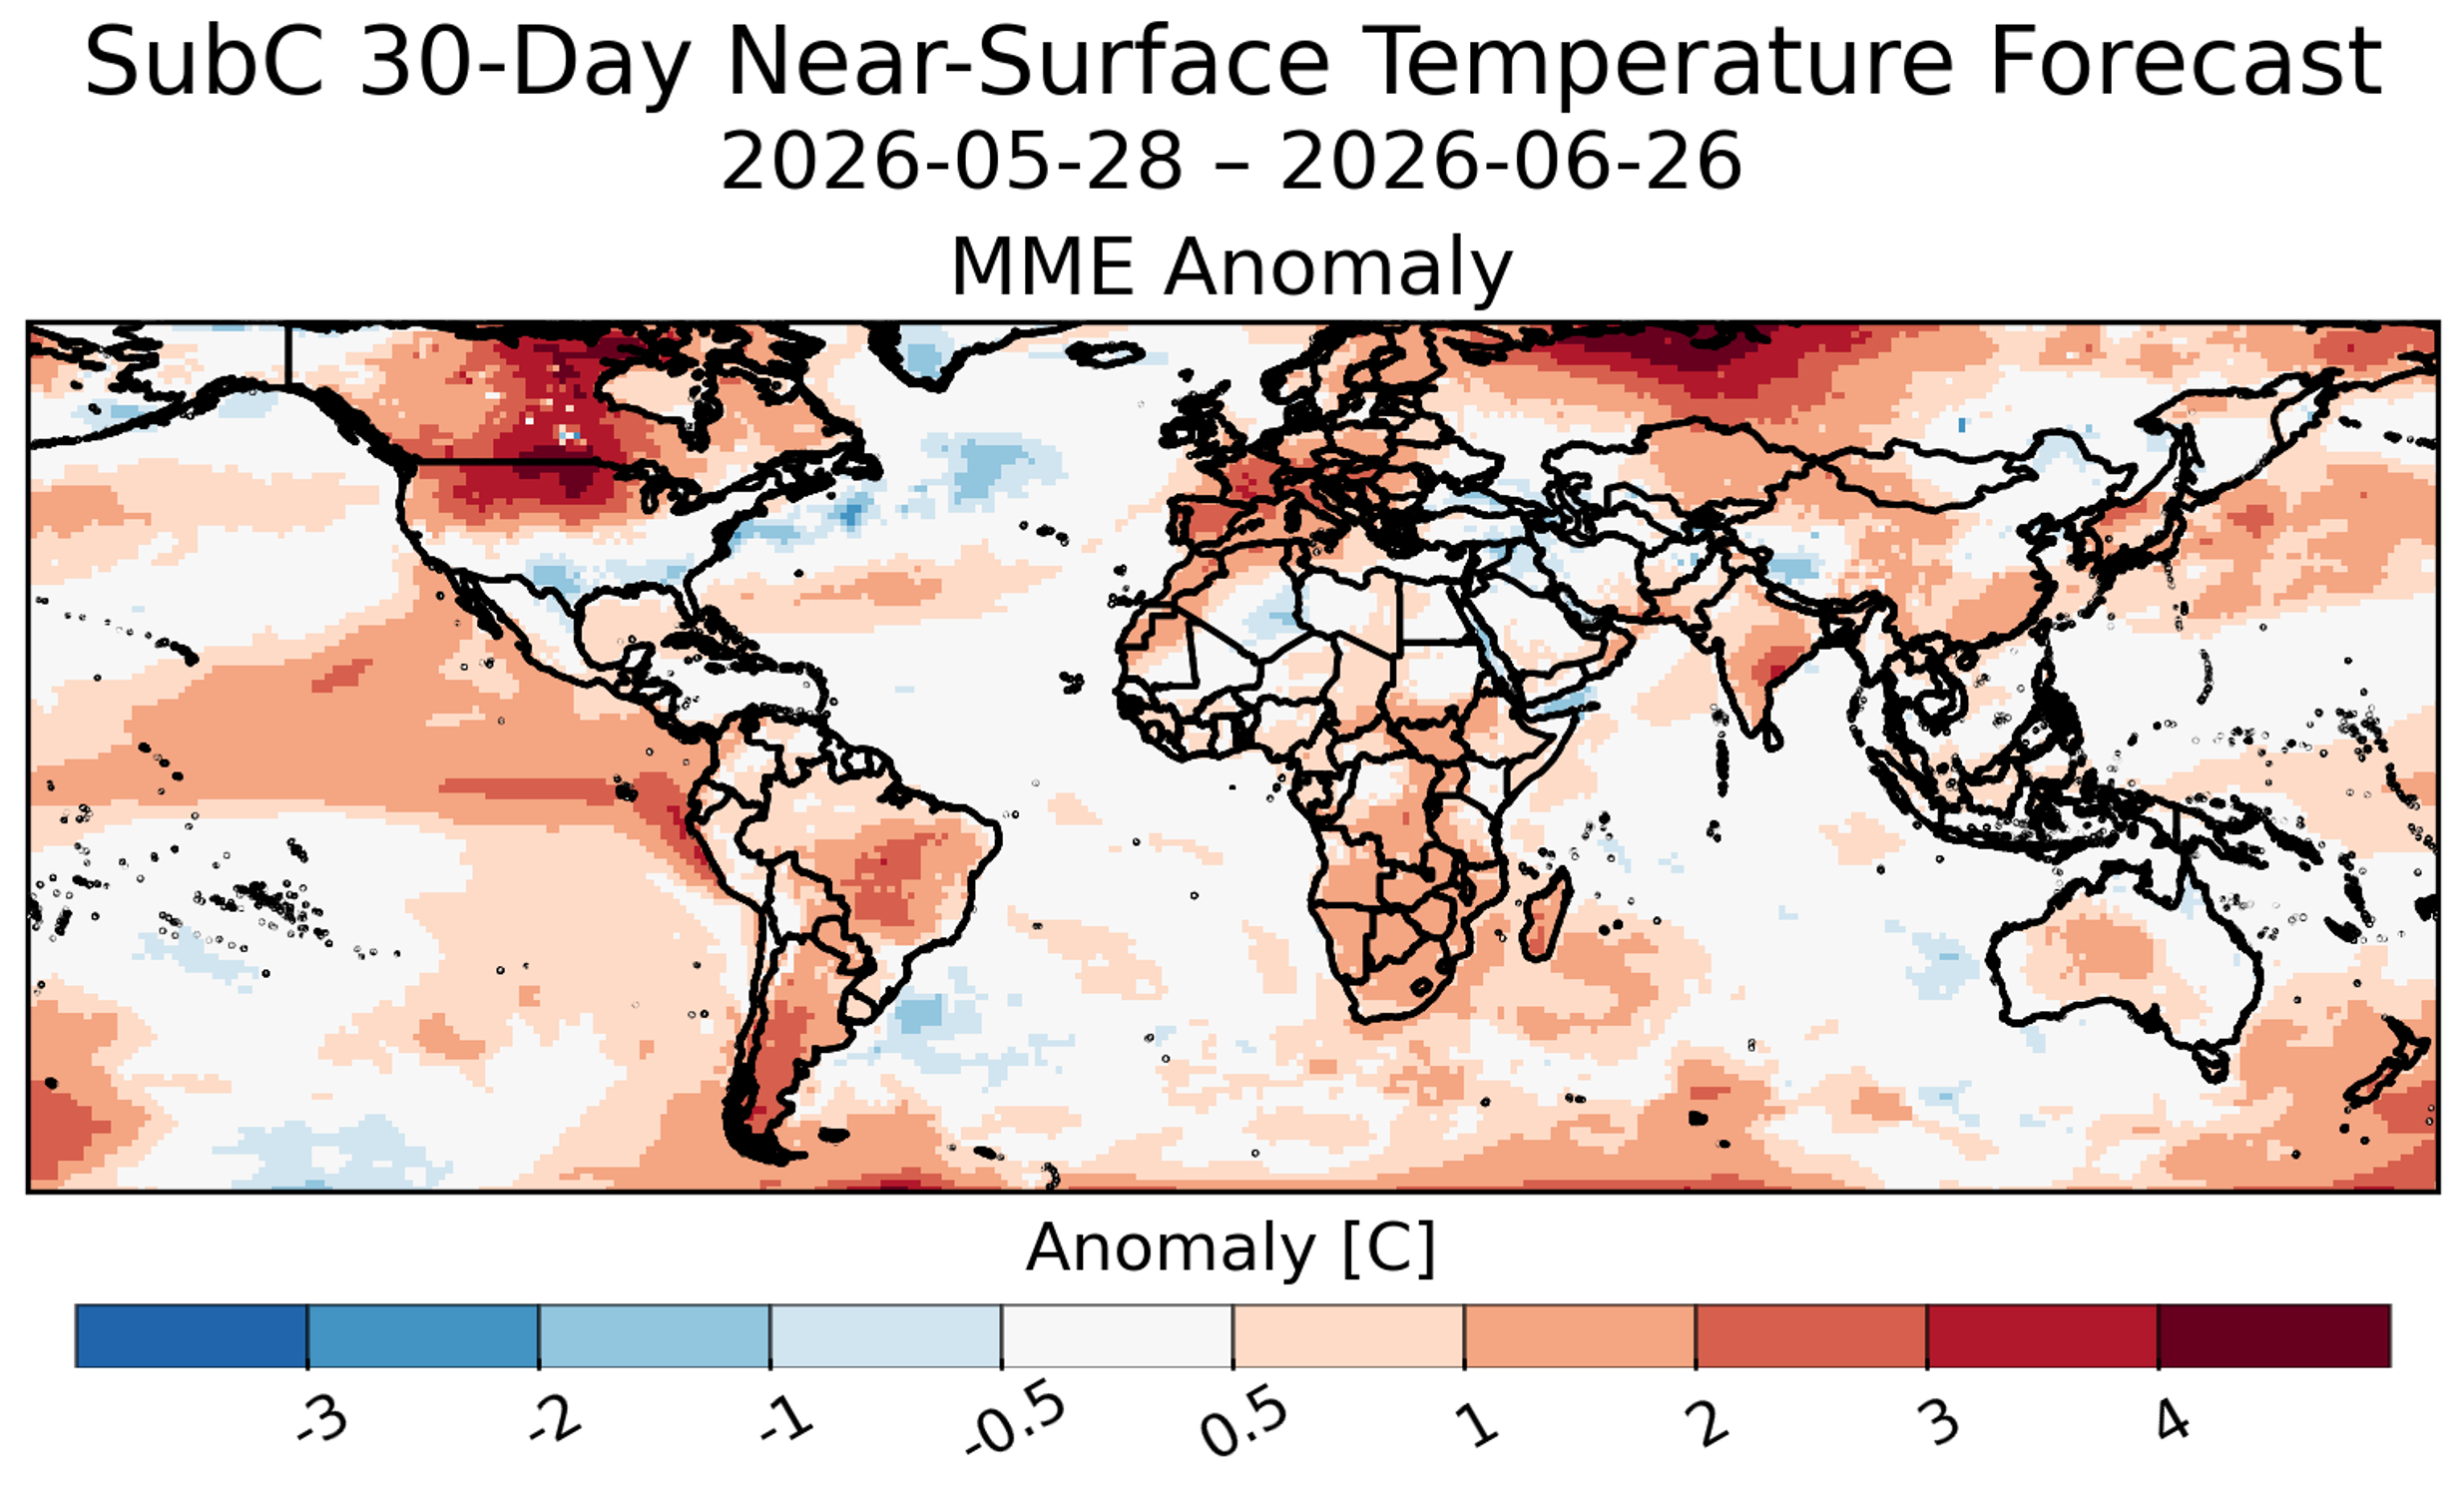
Average temperature anomaly forecast for the next 30 days starting on 28 May 2026, from four Subseasonal Consortium (SubC) models. SubC data accessed from the IRI Data Library. Map source: UCSB Climate Hazards Center
Source: UCSB Climate Hazards Center
Global Two-week Precipitation Forecast
The two-week forecast (Figure 1) shows a chance of above-average precipitation over the southeastern US, southern Mexico, central and southeastern Brazil, Bolivia, southeastern Peru, northern Paraguay, northern Chile, western Argentina, southern Finland, central Russian Federation, southwestern Türkiye, central Mozambique, eastern South Africa, Eswatini, northern and northwestern Kazakhstan, southeastern Kyrgyzstan, eastern Tajikistan, eastern India, southwestern and northeastern China, southern Japan, northern Myanmar, the northern Philippines, and south Australia.
There is also a risk of below-average precipitation over western Canada, Haiti, the Dominican Republic, northern Colombia, central Venezuela, northern and southern Brazil, northern Argentina, northwestern Uruguay, southern Chile, northern Spain, France, Belgium, the Netherlands, western and northern Germany, central Italy, northwestern Romania, southeastern Bulgaria, northern Türkiye, the southern Russian Federation, northern Algeria, southern Mauritania, Senegal, southern Mali, southwestern Cameroon, the southern Central African Republic, the eastern Democratic Republic of the Congo, southern Sudan, eastern South Sudan, Eritrea, Ethiopia, northern and southern Somalia, western Kenya, Uganda, Rwanda, Burundi, northern Tanzania, western and southern India, Sri Lanka, northern China, western Mongolia, central and southern Thailand, central Viet Nam, Malaysia, Indonesia, Papua New Guinea, eastern Australia, and southern New Zealand.
Figure 1: IRI SubX Precipitation Biweekly Probability Forecast for 6 – 19 June, issued on 29 May 2026. The forecast is based on statistically calibrated tercile category forecasts from three SubX models. Source: IRI Subseasonal Forecasts Maproom
Australia Outlook
The June – August 2026 outlook indicates likely below-average precipitation over southwestern Western Australia, Queensland, New South Wales, Victoria, South Australia, and northeastern Tanzania. During this time, maximum temperatures are likely to be above-average over most of the country except for parts of northern Australia. Minimum temperatures are also likely to be above-average across most of the country.
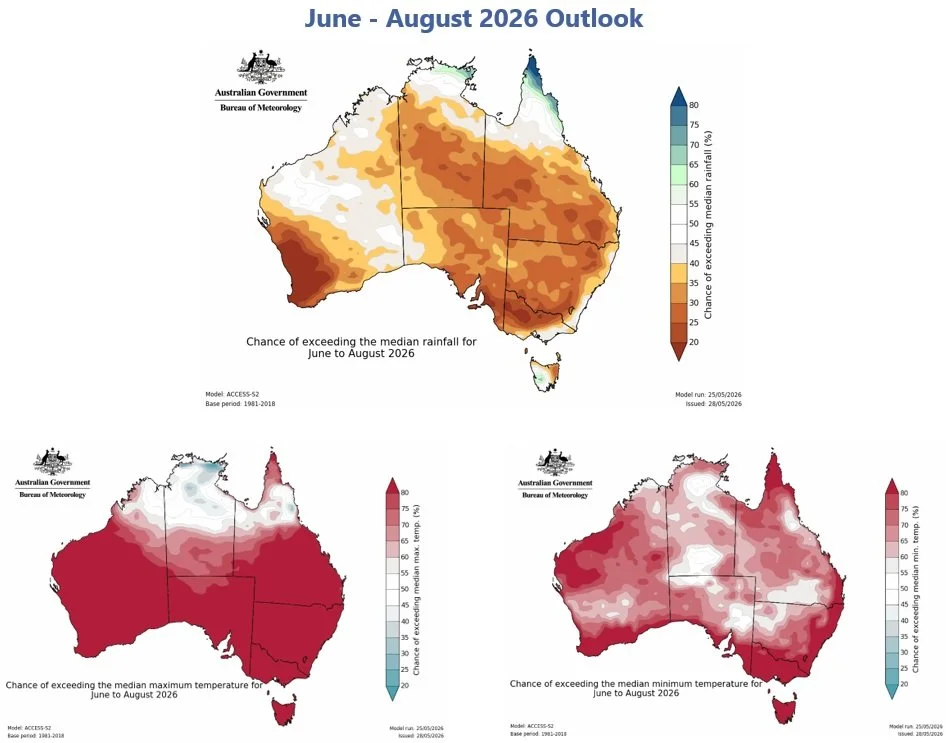
Top: June - August 2026 precipitation anomaly forecast. Bottom Left: June - August2026 maximum temperature probability forecast. BottomRight: April 2026 minimum temperature probability forecast. Maps from the India Meteorological Department
India Outlook
Mixed rainfall conditions occurred from April 1st to May 25th. Some northern region areas developed moderate to large rainfall deficits of 50 to 200+ mm below average, including in the central and northern Philippines, southern peninsular and northwestern Myanmar, central Bangladesh, central Thailand, southern and northeastern Cambodia, southern Laos, and portions of southern Vietnam. Forecast rainfall for the end of May to early June could strengthen the rainfall deficits in Myanmar and Bangladesh and partially improve them in Cambodia and the Philippines, potentially leaving the deficit areas with 60 to 90 percent of average rainfall for April 1st to June 10th, 2026 (Figure 1-left).
As wet season rains develop in northern mainland areas, there is some concern about potential drying influences that have occurred in some areas during past El Niño events, such as in Thailand. The 30-day rainfall forecast from SubC models, as of May 28th, indicates that June rains may be below-average in central Myanmar, northern Thailand, and central Vietnam, and will very likely be below average across southern Southeast Asia (Figure 1 middle-left). Below-normal June to August rainfall has been observed during El Niño events in some of these areas. A multi-model ensemble forecast for July to September (JAS) 2026 rainfall, based on May initial conditions and ECMWF and NMME models, is more indicative of above-normal conditions in various mainland areas. However, May forecasts for JAS 2026 have limited accuracy and model resolution limits confidence in the geographic details forecast within the mainland region. Agroclimatic monitoring will be important as forecasted El Niño conditions develop.
In line with El Niño expectations, seasonal forecasts predict moderate to high chances of below-normal rainfall during JAS 2026 across southern areas (Figure 1 middle-right), and during October to December 2026 in Vietnam, eastern Cambodia, the Philippines, and the southern parts of the Maritime region (Figure 1 right). These forecasts align with a drier dry season and a delayed arrival of wet season rains in the southern areas. During October to December 2026, strong to very strong El Niño conditions are likely (65% chance), and positive Indian Ocean Dipole conditions could develop and reinforce its drying influences. Across Southeast Asia, models forecast much hotter-than-normal temperatures through December 2026.
Figure 1. Left: CHC Early Estimates, which compare the April 1st to June 10th, 2026 precipitation total to the 1996–2025 CHIRPS average for the same accumulation period. This panel uses CHIRPS3 Preliminary for May 1–25, 2026, and a bias-adjusted NCEP GEFS forecast (CHIRPS3-GEFS) for the 15-day forecast from May 26th. Middle-left: SubC multi-model 30-day rainfall tercile probability forecast for May 28th to June 26th, 2026. Colors show the dominant category forecast by four Subseasonal Consortium models, using terciles identified from 1999-2016 hindcasts. From UCSB CHC SubC. SubC data acquired from the IRI Data Library. Middle-right and Right: ECMWF and NMME 3-month multimodel ensemble forecast tercile probability for July to September 2026 (Middle-right) and October to December 2026 (Right) precipitation, from UCSB CHC MME.
Source: UCSB Climate Hazards Center
United States Outlook
The June 2026 precipitation forecast indicates likely above-average precipitation over parts of the central and southern Great Plains and the Southeast, while below-average precipitation is likely over the Pacific Northwest and the northeastern Corn Belt. During this time, temperatures are likely to be above-average over the northern and western halves of the US and Florida, with the highest likelihood over the Pacific Northwest and the northern Great Plains.
The impacts of June’s weather outlook are the likely development or expansion of drought conditions over parts of the Pacific Northwest, northern California, and the central Corn Belt, centred over northern Illinois, southern Wisconsin, and eastern Iowa. At the same time, drought conditions are likely to improve or be removed over parts of the southern Great Plains, the Southeast, and central Montana.
Upper Left: June 2026 precipitation outlook issued on 31 May 2026. Upper Right: June 2026 temperature outlook issued on 31 May 2026. Bottom: June 2026 drought outlook released on 31 May 2026. Maps from NOAA CPC and NOAA/National Weather Service, National Centers for Environmental Prediction, and Climate Prediction Center.